Update: The final part is now available here!
In Part 1 of Sensifying your CV, we created an underlying data model for our Qlik Sense app based on our CV. We also started to create a navigational structure to move around our app easily.
So, onwards!
Creating Master Items for Nav buttons
First thing is to right-click on the Skills button we created and select Add to master items. You will need to give a Name at least to your master item. In this case i have called mine Skills Nav. You might want to add some description and tags (which can be useful for Visual Search in a Qlik Sense app), but we’re gonna keep it fairly vanilla for now. Click Add and you should have your first Master Item. Booyah!

The button we created obviously jumps to the Skills tab, but we need at least 4 other buttons to go to the Summary, Roles, Qlik Branch and Qlik Dev Group tabs. The easiest way i find to do this is to create duplicates in the Master Items menu, which you can find as small chain link icon on the left hand side.
Once you have located that, you can then just right click on your Skills Nav object and hit Duplicate. After that, it’s a case of changing a few properties on each duplicated KPI object to match the tab you want to jump to:
- In Data, change the Jump To Expression to the text of the tab you need i.e. Roles
- In Appearance -> Presentation -> Link to sheet, change the dropdown to the sheet you want to link to.
- In Appearance -> Master Item Details, change the name of the KPI to reflect the sheet you’re jumping to i.e. Nav to Roles etc.
You then need to repeat that process until all of your KPI nav objects have been created.
Optional: In the version i made for myself, i alternated the colours of the KPIs i would be using on each sheet between light and dark green. If you want to do that, you need to duplicate each KPI again, and change the Color in the Jump To Measure.
Once you have completed your Nav buttons, spend a few minutes putting the right Navs in the right sheets. On a standard Qlik Sense design grid, i have 6 x 3 for each nav on the right hand side.

Positioning Nav buttons in your app.
Building the Summary tab
Our navigation is in place now, so let’s start on our first tab. It’s worth noting that from this point onwards, we’ll be dealing with a lot of Text and Image objects, and much of what we need to do is configure these to get the right look and feel and balance.
In the Summary tab, there’s several components:
- 3 highlight / call to action images on the left
- A personal photo, contact details, and Profile statement in the center
- Navs on the right
Aside – It just don’t look right!
Formatting the highlight images posed the first noteworthy issue in the app build. There’s no two ways, images can be a bit of a pain in Sense. In general, there’s 2 ways to embed an image in a Text and Image object – you either click the picture icon and import from the content library, or you set a background image.
Just pick either one, you might think? If only it were that simple…
If you don’t need to link to anything, probably using a background image is best. You can set the Positioning and Sizing attributes and you’ll generally avoid one of the banes of my life in Sense – the Responsive Scrollbar!
However, if you do need to link to a URL or such, you need to Insert an Image into the object and then Edit Link. That’s all cool and fine and all, but try resizing your app in the window or in Chrome and see what happens – Responsive Scrollbars.

It’s a goddamn responsive scrollbar – argghhhh!
Now honestly, i don’t have a real solution for you, but my advice is: be careful. Your app might look beautiful on your 4k high resolution TV, but scale it down a bit and play with the responsiveness to see how it behaves overall.
Another nice surprise is that this also happens with Text! So again, don’t assume that setting all the font sizes to XL or L and letting Sense handle responsiveness resolves the issue. You should treat each object on it’s own merits based on the amount of text against the size of the object. You might even have to play with the size of the object to get the responsiveness to flow just the way you want.
Rant over. For now.
(Back to) Building the Summary tab

So, you need 3 text and image objects, set a background image on those unless you want to link, for reasons discussed above.
Remember to set the Sizing to Always fit and the Position to Center
Create another text and image object and plonk your profile pic in there as a background image.
And another text object for your contact details. I spent a bit of time tinkering with the format and especially the font sizes but settled on something like the below. Remember to set the URL links for stuff like Twitter, LinkedIn, blog etc.
Finally for this tab, you need a text object for your Profile. You could easily load this in from a data source, but for now, and i’m doing a big ole’ copy paste from my CV.
Remember that you can format parts of a Text and Image object individually. So you can make the text green bold and XL in one part, and red, underlined and S in another. Be guided by the Responsive Scrollbars. If they’re around, you need to resize either your object or think about your font sizes.
So, when all is said and done, your Summary tab should like a bit like the one below:

Clean, simple Summary page and not a responsive scrollbar in sight.
Know your Roles
The Roles tab is where the meat of our interactivity will be, utilising our data model. We’ll need several objects here:
- Filter Pane to show our various Positions
- Table object to detail our Employment History
- Pie Chart to show our Skills Utilised
- Text objects for Client List, Role Details and headings
- Variables to get things in the right format
Creating your Position List
We want the position to incorporate the Company Name and the Position, so whilst we could create that in the script, let’s make it visible and changeable as a Master Item, as shown below:

We then want to create a new Filter Pane for our Position Master Item and place it on the sheet.
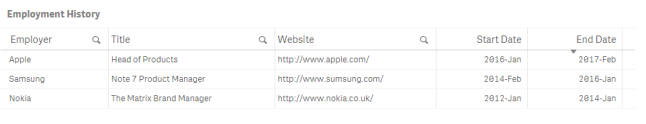
Adding the Employment History
Create a Table object and add the following fields as Dimensions
- Employer
- Title
- Website
In order to make the table always show the full Employment History when selections are being made (otherwise this tab can look a bit spaced out), we need to add to add 2 Measures for the Start Date and End Date.
These Measures use the Only() aggregator and some {1} Set Analysis to ensure that we’re always looking at the full Employment History.
Start Date Expression: Only({1}[Start Date.autoCalendar.YearMonth])
End Date Expression: Only({1}[End Date.autoCalendar.YearMonth])
Note: You might notice that the Start Date and End Date has automatically had a calendar created with it. This is a nifty feature, and saves having to create Master Calendars a lot of the time in Qlik Sense. Neat!
Now when you make a selection anywhere in the app, the table and it’s full contents are omnipresent – just what we want.
Showing our Utilised Skills
This is down to personal preference, but i like using a donut variant of a pie chart for this. (Mainly because of the spinning pie chart easter-egg you can invoke by rolling the mouse wheel when on the object )
Create a new Pie Chart in Sense, and add Skill as a dimension. For the Measure, use the Percentage field. Change the Appearance -> Presentation setting to Donut and you should get something like the below:
Optional: Now, you might be happy with the default colours or the options that Sense offers, but i decided to Qlik-ify my chart with green and used the following expression under Appearance -> Colors and Legend -> Colors -> By Expression:
If(Skill = ‘QlikView’, ARGB(255,0,255,0),
If(Skill = ‘QlikView Server’, ARGB(120,0,255,0),
If(Skill = ‘Qlik Sense’, ARGB(90,0,255,0),
If(Skill = ‘Qlik Sense Server’, ARGB(70,0,255,0),
If(Skill = ‘nPrinting’, ARGB(50,0,255,0),
If(Skill = ‘Pre-Sales)’, ARGB(70,0,255,150),
If(Skill = ‘Training’, ARGB(120,0,255,150),
If(Skill = ‘Support’, ARGB(170,0,255,150),
If(Skill = ‘Extensions (D3, HTML5)’, ARGB(220,0,255,150), Yellow())))))))))

Qlikified Pie Chart vs normal – you decide
Role Details and Variables
In order to read out the details for our roles from our Excel sheet, we need to create some variables that we can drop into a text object at the correct place.
We can create variables using the small symbol in the bottom left hand corner in Edit Mode. Then we Create New variables as per below:
Repeat the below for vBullet1, vBullet2, vBullet3, vBullet4, vBullet5, changing vBulletx and [Bullet x] accordingly.
vBullet1: If(GetSelectedCount(Position) = 1 and Len([Bullet 1]) > 0, ‘ ● ‘ & Only([Bullet 1]))
vComments: If(GetSelectedCount(Position) = 1, Comments)
vSelectClient: If(GetSelectedCount(Position) 1, ‘Please select one Position to see’ & chr(13) & ‘the Role Description’)
vComments reads the Comments field, which should always be available.
vBulletx fields show the additional achievements in the role, and are optional, as are the Bullet 1 -5 fields in the data model.
vSelectClient is used to prompt the user to select a single Position, as this format only works when loading data in from one Position at a time.
Once the variables are good, you need to place them in the Text object to make the spacing look right. I placed the variables like below and it seems to work pretty good:

Looks odd but produces decent results
Note: vSelectClient is kind of hidden in among vBullet2 and vBullet3. In this case, it would be great to use an extension to have more granular control, and i’m even missing QlikView here with it’s pixel perfect capabilities and overlapping text boxes.
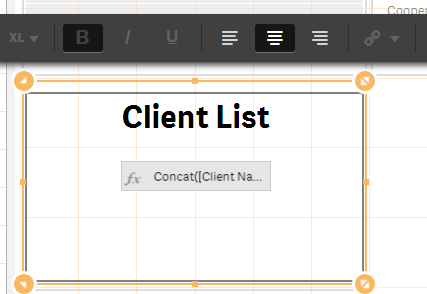
Showing the Client List
Our Client List is not too complicated, but it’s up to you whether you want to use it, or if confidentiality is an issue. Better to have the option than not, right?
In a Text object you need to add a new Measure which does the following expression:
Concat([Client Name], ‘, ‘)
Now, when you make selections in your Position filter pane, you’ll get the clients applicable for each Position. Assuming you modified the spreadsheet!
After this, there’s just a few more Text Objects to include to set some titles (watch out for font sizing!) and we…are…done. For the Roles tab, of course!

In the Final Part…
We’re really motoring now, having created the Roles and Summary tabs. Nearly there, and in the final part we’ll finish with:
- Creating the Qlik Branch and Qlik Dev Group tabs
- Styling our app to make it look more professional
- Upload and distribute via Qlik Sense Cloud
- Links to all the files used for this project and final app
I hope you’re still with me and will makeitqlik for the last part. I would love to hear our thoughts, so please comment and share below 🙂
May you Qlik happily until next time,
Brian

Hi Brian
First, thank you for these two first wonderful articles 🙂
Do you know when you plan to release the last / final part of your tutorial?
I’m especially interested in the part ‘Upload and distribute via QS Cloud’ 🙂
Thank you very much,
Regards,
Benjamin
LikeLike
Hi Benjamin,
Thank you for the kind words, but more importantly, i’m please to let you know that the final part is now available. Hope you enjoy, and would be happy to hear your feedback!
LikeLike